Beating the Benchmarks: How My 1960s Split-Level Outperformed Efficient Homes
Published on February 05, 2026 by Claudio Cabete
For a few months I’ve been building a fully empirical model of my home’s heating behavior — cycle logs, UA curves, mass‑weighted thermostat control, vent zoning, and a furnace efficiency diagnostic that actually reflects physical reality. This month, the utility data finally delivered the kind of validation every engineer secretly hopes for.
Here’s the comparison that landed in my inbox:
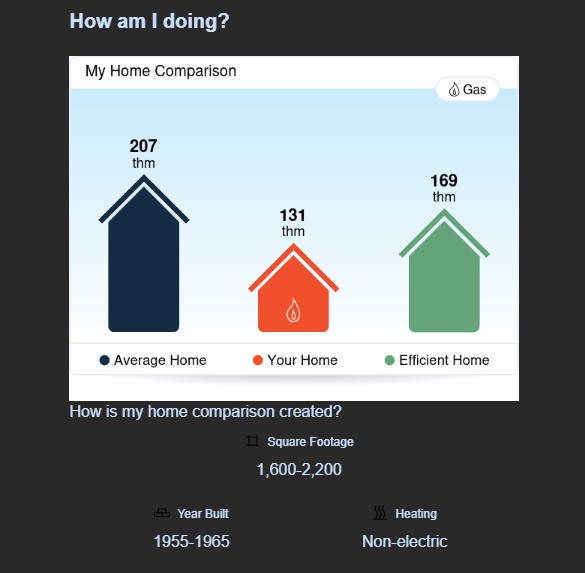
My home used 131 therms.
The “average” peer home used 207 therms.
Even the so‑called “efficient home” benchmark landed at 169 therms.
These aren’t small deltas. They’re structural.
What Makes This Win Meaningful
1. A 1955–1965 split‑level isn’t supposed to do this
Older envelopes leak. Ductwork is imperfect. The geometry is weird. And yet, with the right empirical tuning, the house behaves like a modernized system.
2. The model predicted this outcome
The calibrated ON/OFF cycle model, the stable UA separation, and the flipped mass‑weighting thermostat strategy all pointed toward lower runtime — and the gas bill confirmed it.
3. Dynamic gas‑flow control made a measurable difference
One of the biggest breakthroughs this winter was the adaptive gas‑flow regulator I built.
Instead of assuming a fixed furnace efficiency, the system:
- reads the real‑time outdoor temperature
- computes the optimal gas‑flow rate for that specific ΔT
- adjusts the furnace’s gas input dynamically
- and uses furnace efficiency as a diagnostic signal, not a constant
This keeps the furnace in its most efficient operating band while avoiding the classic “overfire in mild weather, underfire in deep cold” problem. The result is smoother cycles, better comfort, and lower therms.
4. Every improvement was grounded in measurement
No “rules of thumb.” No folklore. Just:
- Cycle‑level heat loss curves
- Delivered‑heat diagnostics
- Vent zoning experiments
- Comfort‑cost tradeoff modeling
- Real‑world validation against utility data
This is the part most homeowners never see: the invisible engineering behind a comfortable, low‑cost winter.
Why I’m Sharing This
Energy costs are rising. People are frustrated. And most advice online is either oversimplified or flat‑out wrong.
My goal with Homatica is to show what’s actually possible when you combine:
- transparent data
- reproducible experiments
- and a little engineering stubbornness
If a 60‑year‑old split‑level can beat the “efficient home” benchmark by 22%, then there’s a lot of untapped potential out there.
More posts coming soon — including the full predictive runtime model and the comfort‑cost dashboard that ties all of this together.
— Claudio Cabete, Homatica